
Many companies track course completions, training hours, and attendance. These numbers show activity, but they do not show whether employees gained useful skills. They don’t tell if employees moved closer to their career goals.
Employee development metrics help close that gap. They can show skill growth, use of new skills, career movement, and manager support. This article covers 12 practical metrics, with formulas, benchmark ranges, and tracking cadence. It also explains how to measure skills gaps with clear proficiency levels and stronger evidence than self-reported skills alone.
What Do Employee Development Metrics Tell You?

These metrics show how employees build skills, improve at work, and move toward career goals. They help HR teams and managers track more than course completion.
Useful measures can cover learning activity, skill growth, career progress, and manager support. Some are early signs of progress. Others show later results, such as promotions or internal moves.
A strong dashboard uses both types. It should show what employees did, what they learned, and what changed after the learning.
Which Employee Development Metrics Should Companies Track?
The metrics listed here can give most companies a useful view of development. The benchmark ranges below are just starting points. Adjust them for job type, company size, and workforce needs.
1. Participation and Development Activity Metrics
| Metric | Formula | Benchmark | Tracking |
| Development Plan Completion Rate | Employees who complete planned actions ÷ eligible employees × 100 | 80%–90% | Monthly or quarterly |
| Learning Participation Rate | Employees completing one relevant activity ÷ eligible employees × 100 | 70%–85% | Monthly |
| Development Hours per Employee | Total development hours ÷ average headcount | 20–40 hours per year | Quarterly |
Development Plan Completion Rate shows whether development plans are active. A plan should include a skill, clear action, target date, and proof of progress. Good employee development goals can make these plans easier to track.
Learning Participation Rate shows reach and engagement. A low rate may point to poor access, low manager support, or learning that does not match job needs. High participation does not prove that learning worked.
Development Hours per Employee shows how much time goes into development. Use it as a resource measure, not a success measure. Ten hours of focused practice on an important skill may be more useful than 40 hours of low-value content.
2. Skill Growth and Learning Effectiveness Metrics
| Metric | Formula | Benchmark | Tracking |
| Skill Proficiency Gain | Average post-assessment level − baseline level | +0.5 to +1.0 level on a 5-point scale | Quarterly |
| Learning Application Rate | Employees showing the target skill at work ÷ employees trained × 100 | 60%–75% | Quarterly |
| Assessment Improvement Rate | Employees with a higher follow-up score ÷ employees assessed × 100 | 70%+ | After major programs |
Skill Proficiency Gain is one of the most useful employee development metrics because it measures change in skill level. For example, an employee may move from Level 2, “developing,” to Level 3, “independent.”
Learning Application Rate asks whether employees use the new skill at work. Evidence can include work samples, project results, or customer results.
Assessment Improvement Rate helps separate learning from attendance. If many employees complete a program but few improve their scores, then something is wrong. The content, practice, or assessment may need a review.
3. Career Progression and Retention Metrics

| Metric | Formula | Benchmark | Tracking |
| Internal Mobility Rate | Employees moving to another internal role ÷ average headcount × 100 | 8%–15% per year | Quarterly |
| Development-Linked Promotion Rate | Promoted employees who met development goals ÷ total promoted employees × 100 | 70%+ | Quarterly or annually |
| Development Retention Rate | Development-plan completers still employed after 12 months ÷ plan completers × 100 | 85%+ | Annually |
Internal Mobility Rate shows whether employees can turn new skills into new roles. A low result may point to weak career paths. It highlights limited openings or poor access to internal jobs.
Development-Linked Promotion Rate does not mean that completing a course should lead to a promotion. It checks whether promoted employees built the skills expected at the next level.
Development Retention Rate should be used with a comparison group. Employees who join development programs may already be more engaged, so a higher retention rate does not prove that development caused the result.
4. Manager-Level Accountability Metrics
| Metric | Formula | Benchmark | Tracking |
| Manager Coaching Completion Rate | Employees receiving required coaching ÷ employees expected to receive it × 100 | 85%–95% | Monthly or quarterly |
| Development Goal Review Rate | Employees with goals reviewed on time ÷ employees with active goals × 100 | 90%+ | Quarterly |
| Manager Development Support Score | Average employee survey score on manager support | 4.0+/5.0 | Quarterly or twice yearly |
Manager Coaching Completion Rate checks whether coaching conversations happen on time. Managers play a key role in turning plans into action.
Development Goal Review Rate shows whether managers discuss progress, barriers, and next steps. A goal that sits in a system for months without review is not an active development plan.
Manager Development Support Score adds the employee view. Ask whether managers give useful feedback, support skill growth, and help employees work toward career goals.
Only 15% of employees say their manager helped them build a career plan in the past six months. This makes manager support a useful metric for measuring whether development plans are actually being supported.
How Should These Employee Development Metrics Work Together?
No single number can show whether development is working. The value comes from linking the measures. Using the right employee development strategies can help organizations turn these measurements into practical actions.
“We have to create goals in a more agile way, give people lots of feedback, and coach people to succeed.”, says Josh Bersin, CEO of the Josh Bersin Company. This supports the idea that development works best when everything is connected.
A simple path is:
Learning participation → skill gain → skill use at work → internal mobility → retention
Another is:
Manager coaching → goal review → skill practice → career progress
These links help you find weak points. The goal is not to push every number higher. The goal is to find where development slows down and fix that part of the process.
How Can You Measure Skills Gaps in More Depth?
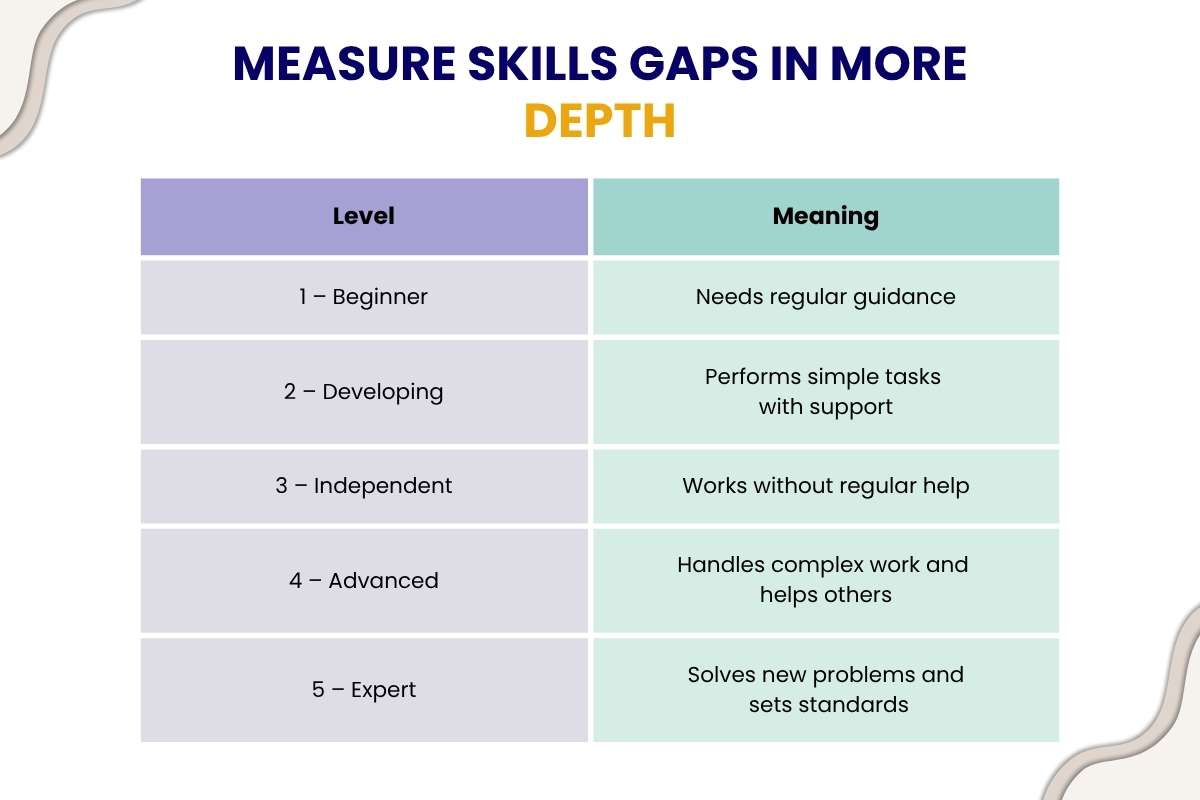
While measuring employee development metrics, a useful skills-gap process compares the skills a role requires with an employee’s current proficiency. Start with a skills taxonomy that defines key skills for each role or job family. This creates a common standard across the company.
Use a simple five-level scale:
| Level | Meaning |
| 1 – Beginner | Needs regular guidance |
| 2 – Developing | Performs simple tasks with support |
| 3 – Independent | Works without regular help |
| 4 – Advanced | Handles complex work and helps others |
| 5 – Expert | Solves new problems and sets standards |
Then calculate:
Skill Gap = Required Proficiency − Current Proficiency
If a role requires Level 4 data analysis and an employee is at Level 2, the gap is two levels.
Do not rely only on self-assessments. Confirm skill levels through manager reviews, assessments, work samples, or project results. Reassess skills after three, six, or 12 months to track progress. A change from 2 → 3 → 4 shows measurable growth.
Also Read: How to Use Employee Upskilling Programs to Build Future-Ready Teams?
How Can Employee Development Metrics Support Better Decisions?
A useful metric should lead to action. If a number does not change a decision, it may not belong on the dashboard. More than 70% of organizations still rely on static reporting, showing the gap between collecting data and using it to guide decisions.
Use the data to ask:
- Which skills have the largest gaps?
- Which teams are improving fastest?
- Which managers support growth well?
- Are employees using new skills at work?
- Are employees moving into roles that use those skills?
Break results down by team, role, level, or location. Company-wide averages can hide weak areas.
Conclusion
The best employee development metrics connect effort, skill growth, and outcomes.
These six core measures can help you get started: development-plan completion, learning participation, skill proficiency gain, learning application, internal mobility, and manager support. Add more as your data improves.
Do not confuse activity with progress. Course completions and learning hours show what employees did. Skill growth, skill use, and career moves show what changed. A balanced dashboard helps HR spot skill gaps and show how employee growth supports business needs.
FAQs
1. What are the most important employee development metrics?
Skill proficiency gain, learning application, and internal mobility are strong starting points.
2. How can managers be measured on employee development?
Track coaching completion, development-goal reviews, employee feedback, and progress on team skill goals.
3. How do you measure skill improvement over time?
Use a common proficiency scale at baseline and follow-up points, then confirm progress. You can use it with assessments, manager reviews, etc., to check progress.